5.0
Environmental Stewardship
The environmental section of this report marks the sixth instalment in a series of annual reports published by the RED Sustainable Solutions and Climate Change team. The primary purpose of this section is to track and benchmark our environmental impact while outlining our plans to achieve net-zero emissions. By sharing our environmental footprint, strategies for reducing impact, and progress to date, we offer stakeholders a transparent view of our sustainability journey.
This enables management to review our methods and ensure we achieve actual reductions in our footprint incrementally to zero. Our approach will eventually address not only carbon but all other greenhouse gas (GHG) emissions, biodiversity, and other non-financial performance indicators within our ESG road map.
Our baseline was established in 2019, at which point we measured our energy usage, carbon generation, and several other key performance indicators (KPIs) against which we measure our environmental performance. This report discusses our progress against our overarching targets on an annual basis for the foreseeable future.
In 2024, we continued to enhance our energy and emissions data processes to improve data quality and more accurately track our performance over time. Notably, we rolled out a new company-wide commuting survey and created an embodied carbon calculator for MEP systems and services. Recognising that our environmental impact extends beyond fuel and energy-related emissions, we are currently expanding our Scope 3 coverage to include all relevant reporting categories from our value chain. The expanded Scope 3 inventory will be included in our 2025 reporting.
RED is committed to accurately assessing and reporting our environmental footprint across all global offices. By tracking key impact areas such as utility consumption, business travel, commuting, remote work, and water usage, we ensure a comprehensive understanding of our sustainability performance. Establishing a clear baseline, as we did in 2019, allows us to set measurable targets and monitor progress over time.
Integrating environmental performance into our strategic planning not only reduces risk and operational costs but also supports compliance with ISO 14001 and ISO 50001 standards. As part of ENGIE Global’s reporting framework under Tractebel, RED remains committed to transparent environmental stewardship and continuous improvement.
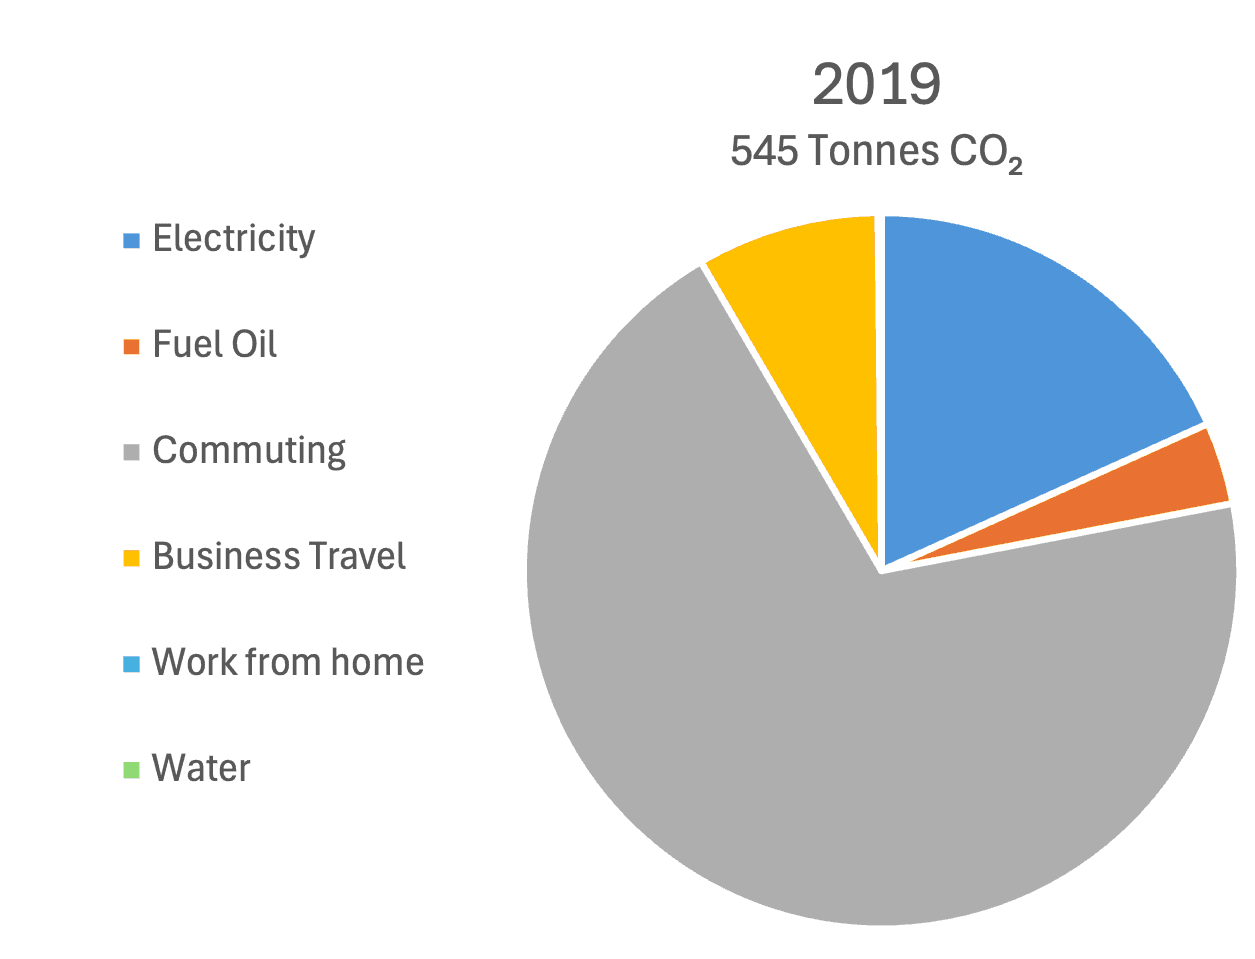
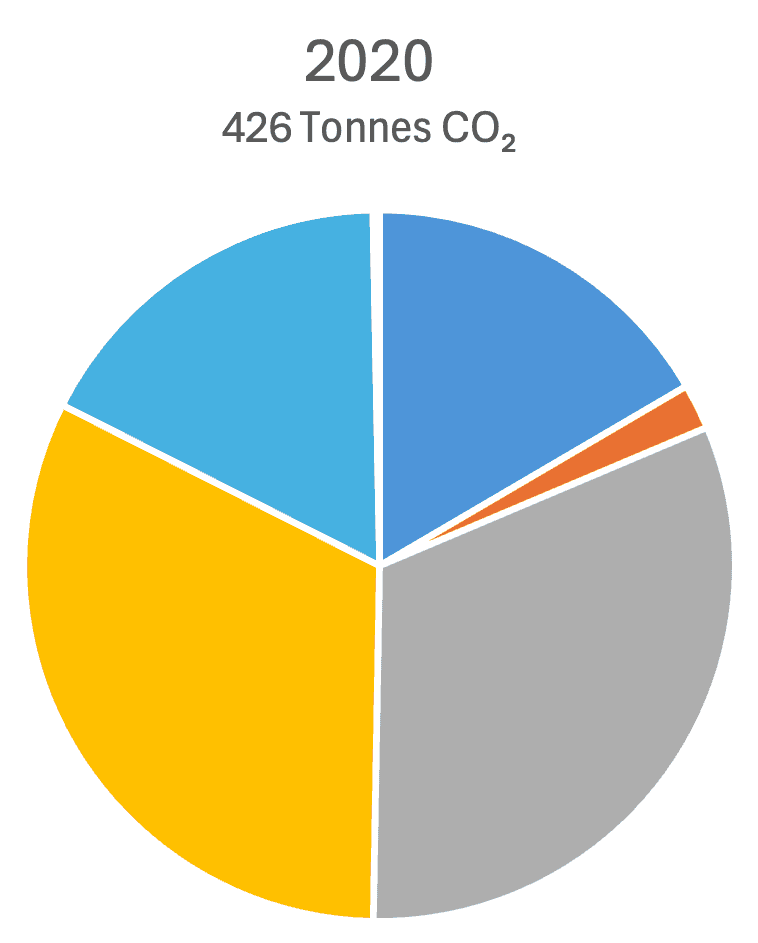
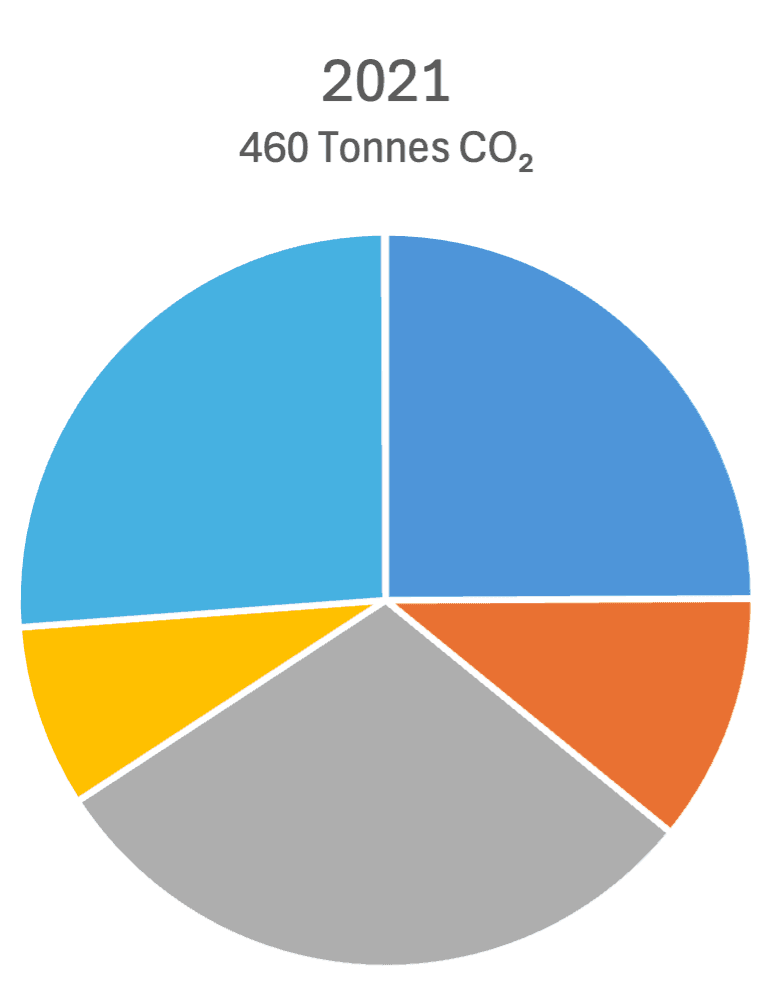
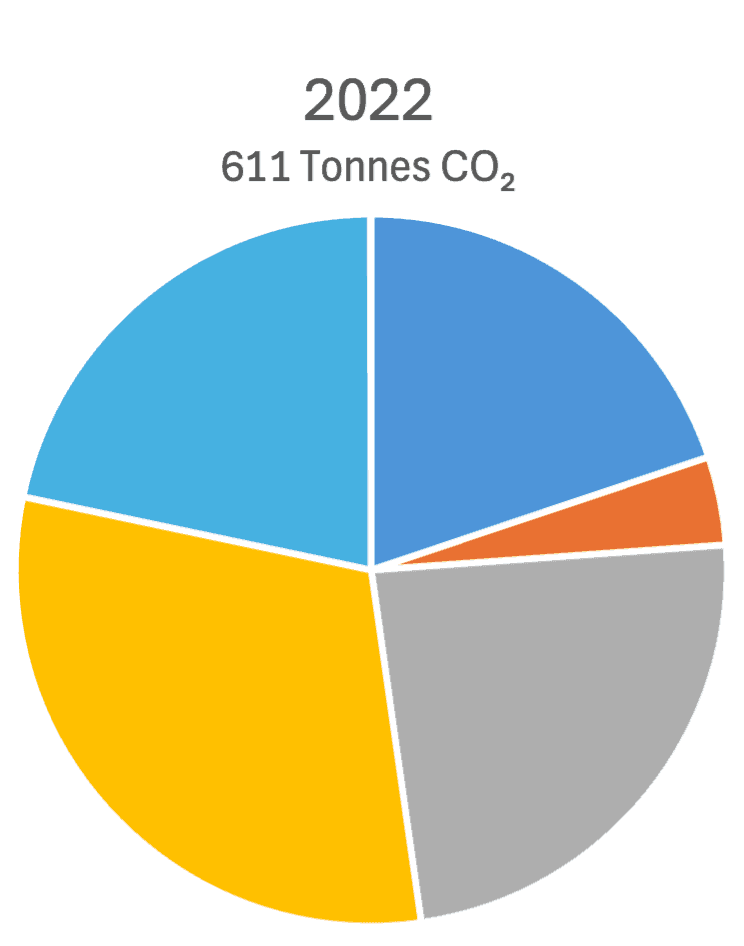
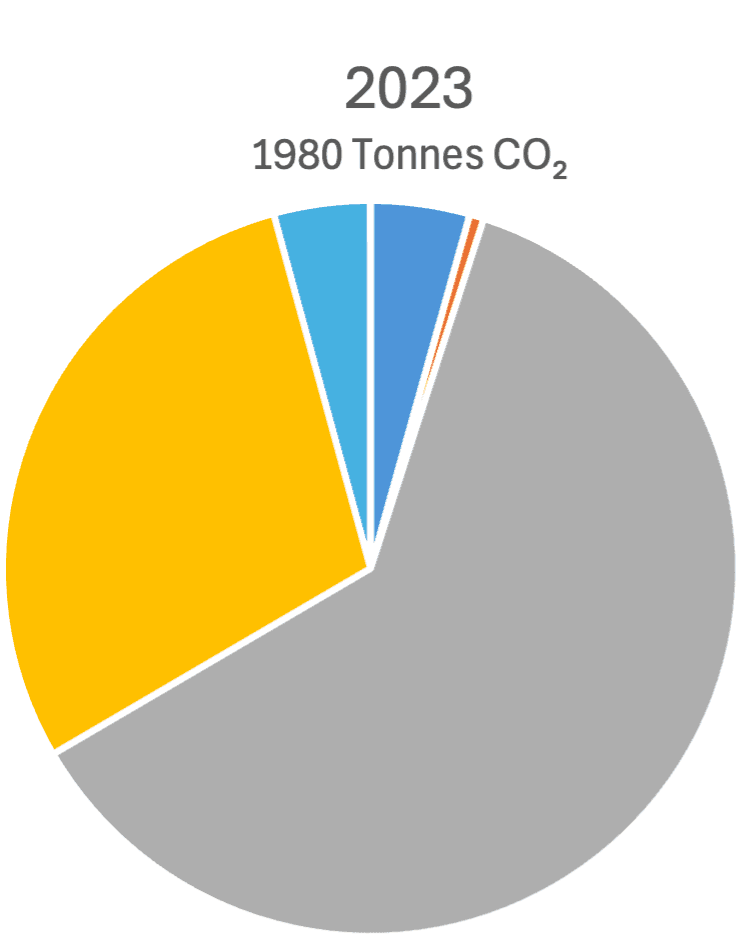
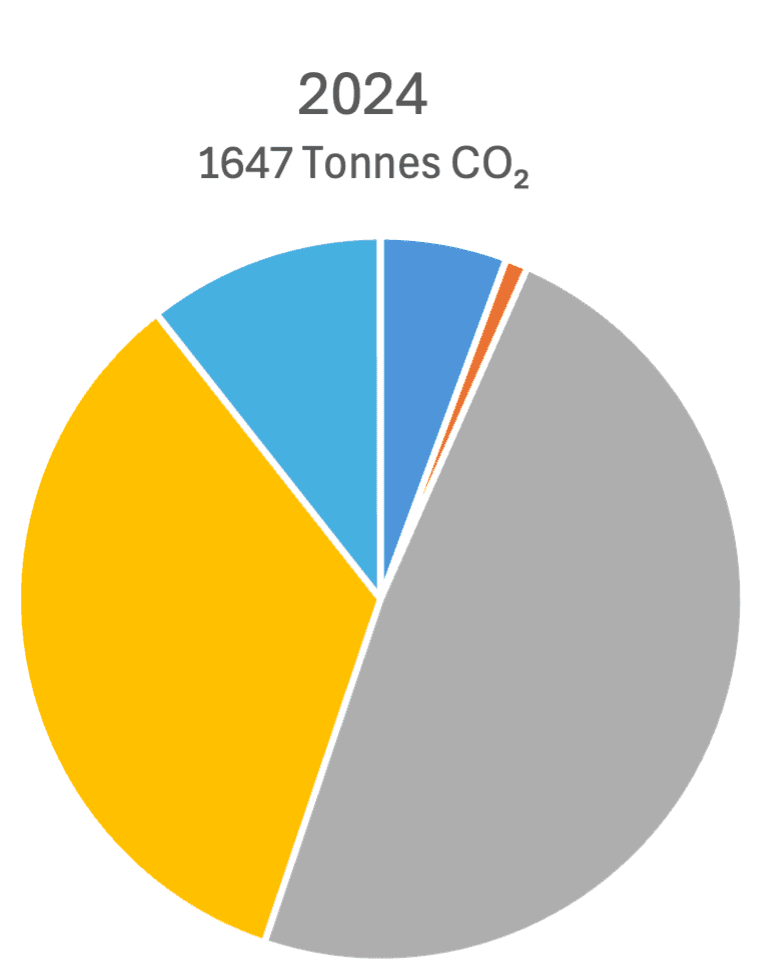
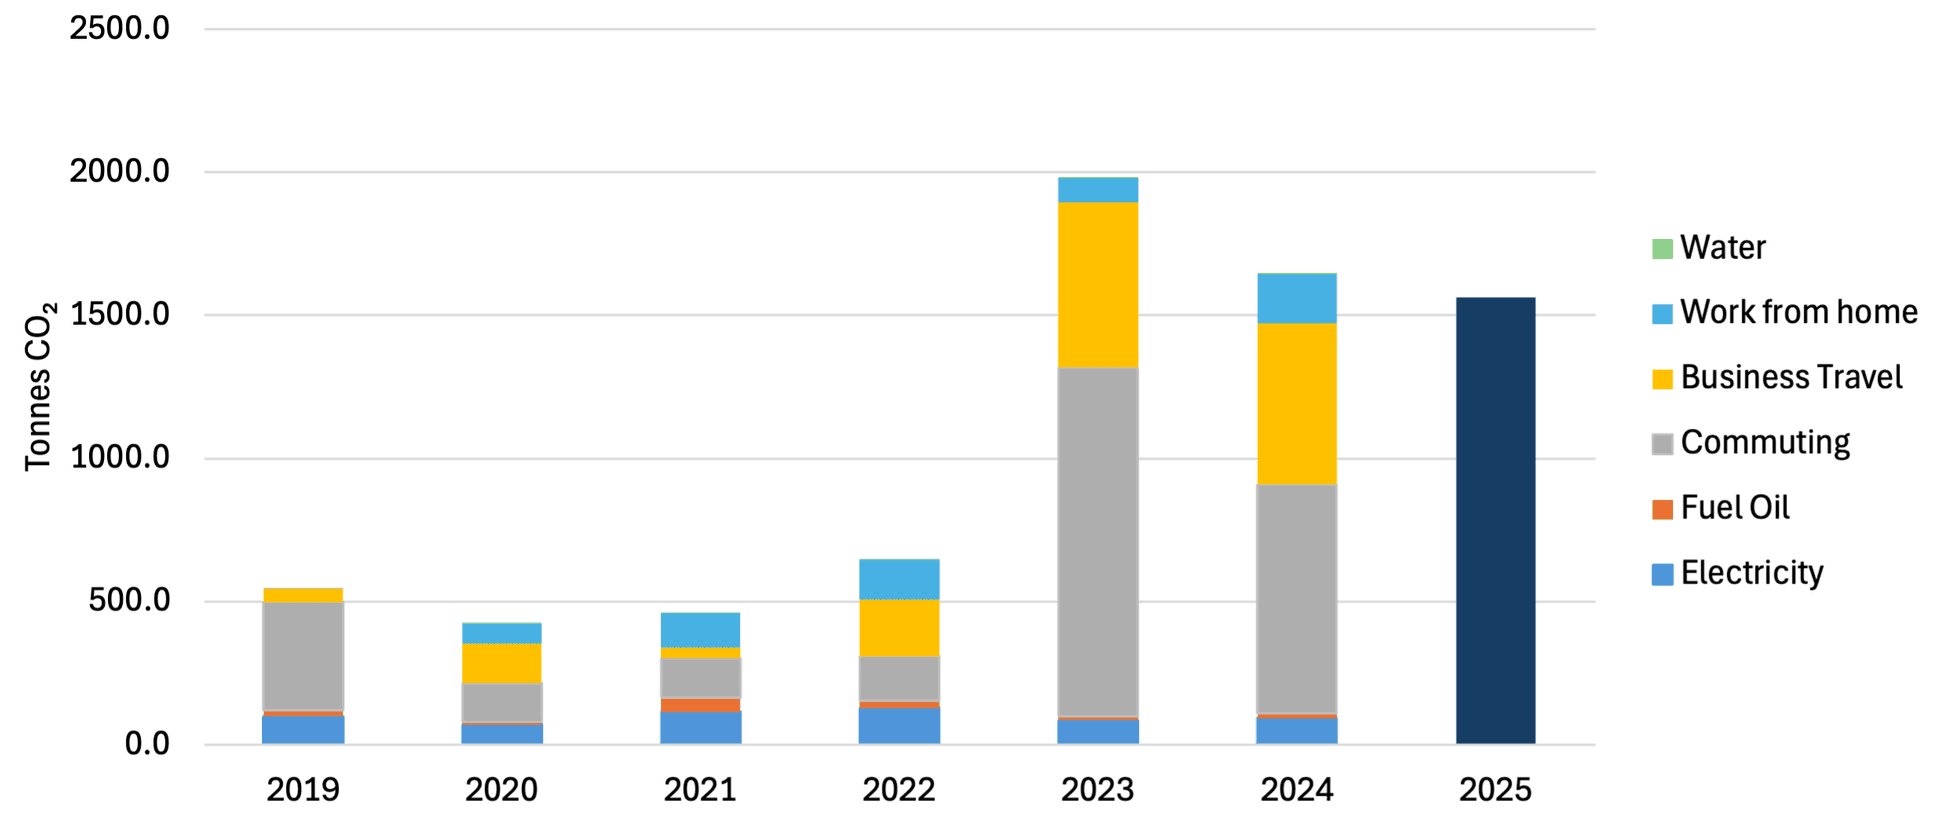
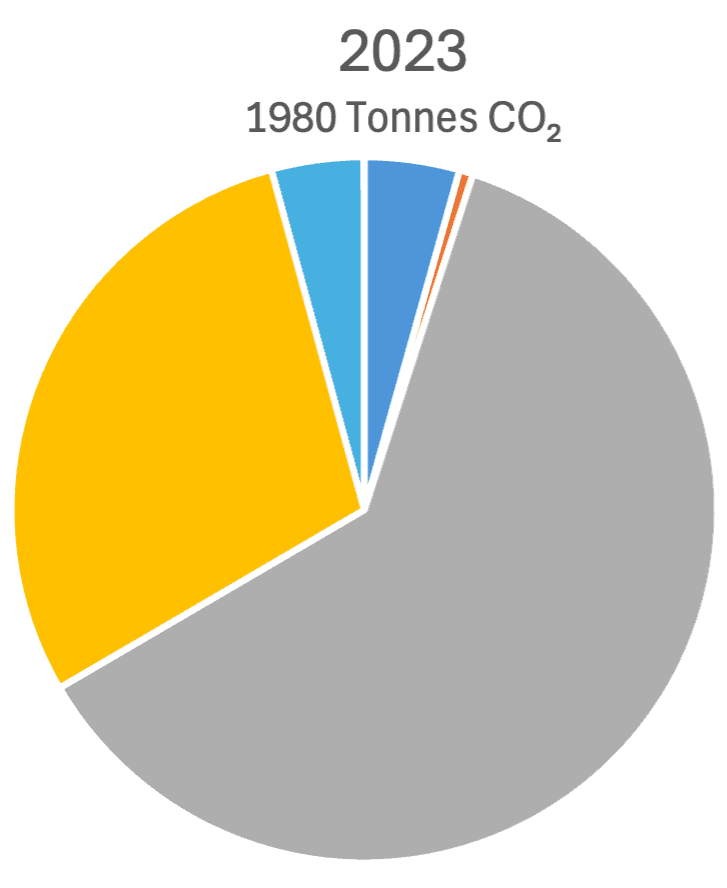
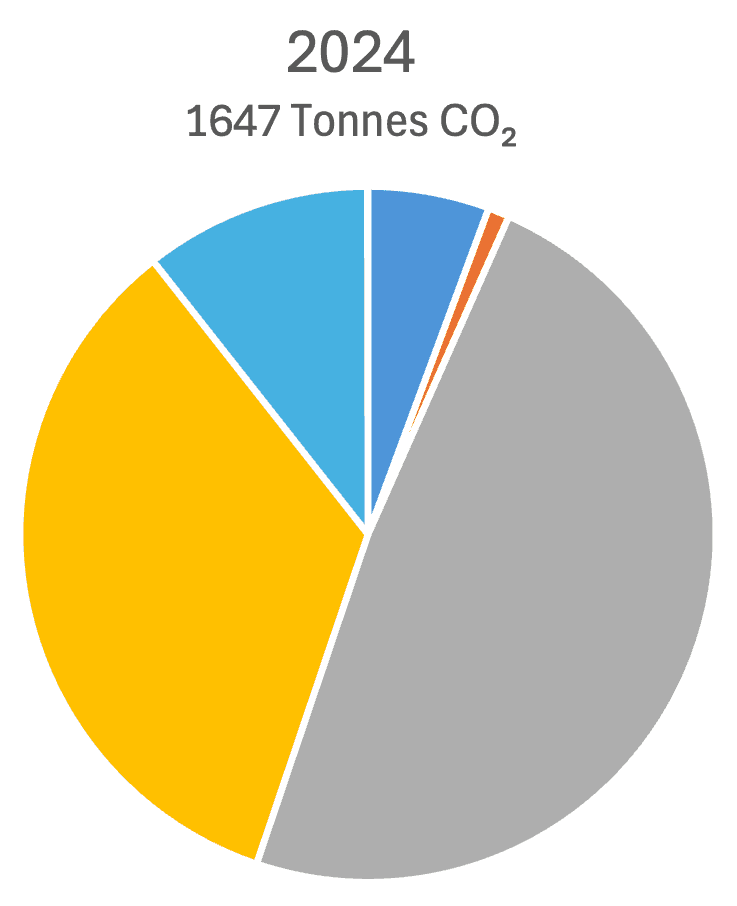
The Performance Dashboard provides a comprehensive overview of CO2 emissions trends from 2019 to 2024, highlighting key shifts in workplace energy use, commuting patterns, and sustainability efforts. The data shows a sharp decline in emissions during 2020 and 2021, corresponding with the rise in remote working. However, from 2022 onwards, emissions climbed again, peaking in 2023 due to an increase in commuting-related CO2 output. The 2024 figures reflect a notable decrease in total emissions, mainly due to a reduction in commuting-related emissions. This decrease is attributed to previous over reporting in certain regions caused by outliers (errors) in survey data.
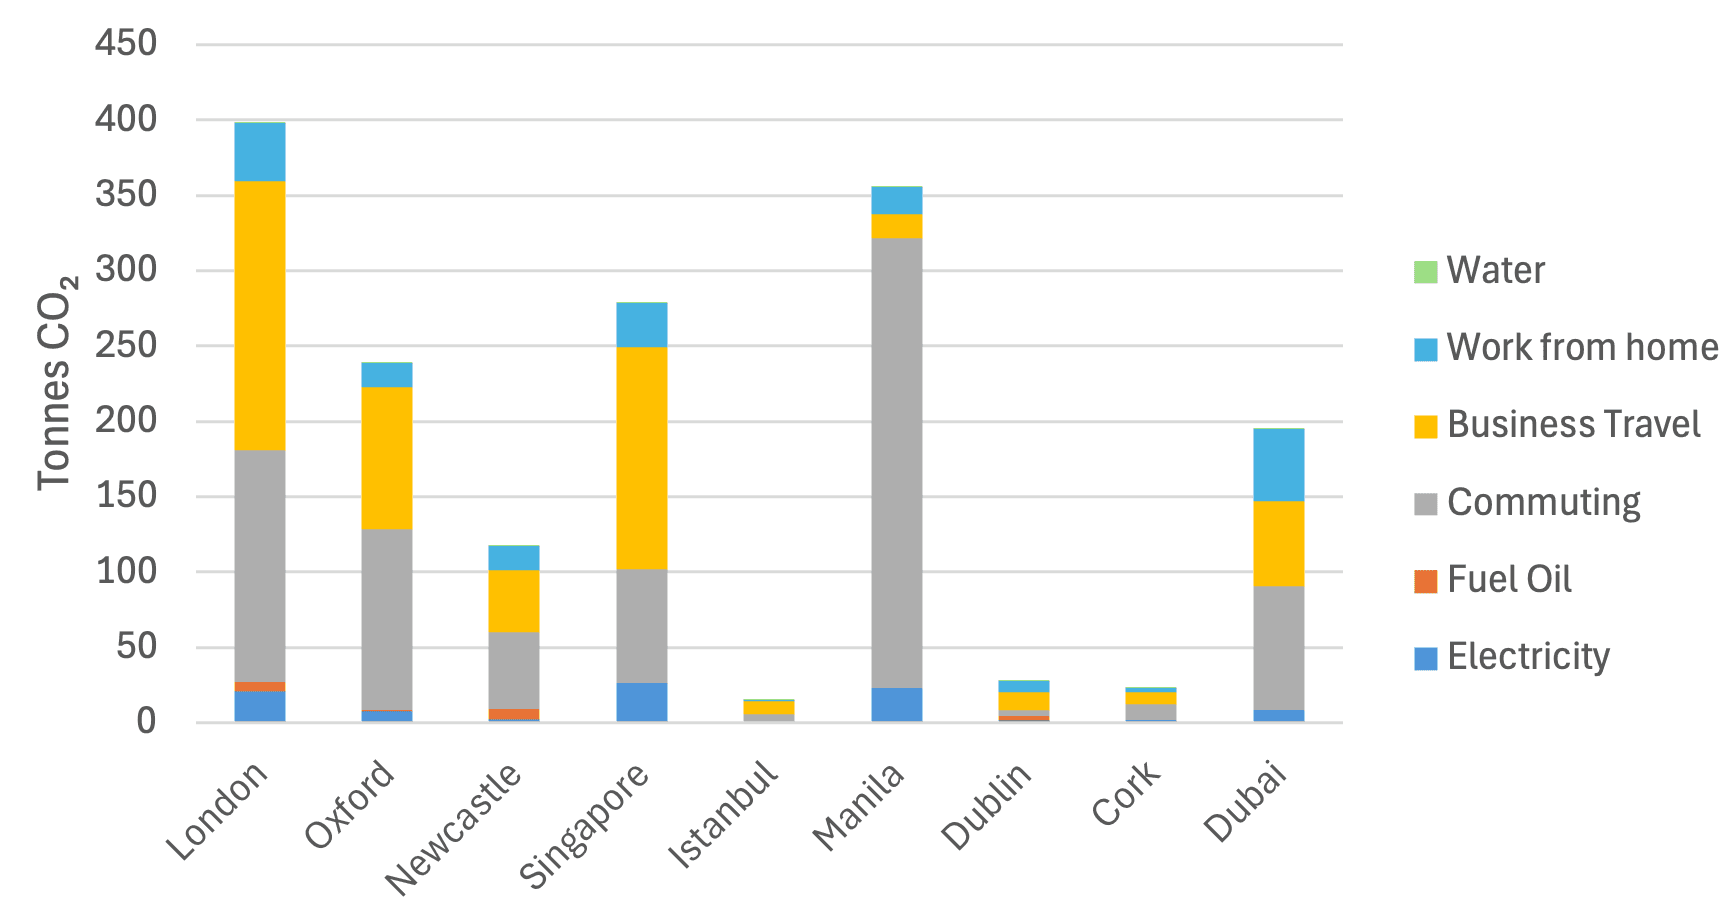
Carbon emissions on an office-by-office basis, as shown in Figure 3, confirm that commuting and business travel remain RED's two largest consumption categories across all sites. These areas continue to be the focus of corrective actions, underscoring the importance of the dashboard as an essential tool for monitoring environmental impact and informing future sustainability strategies.
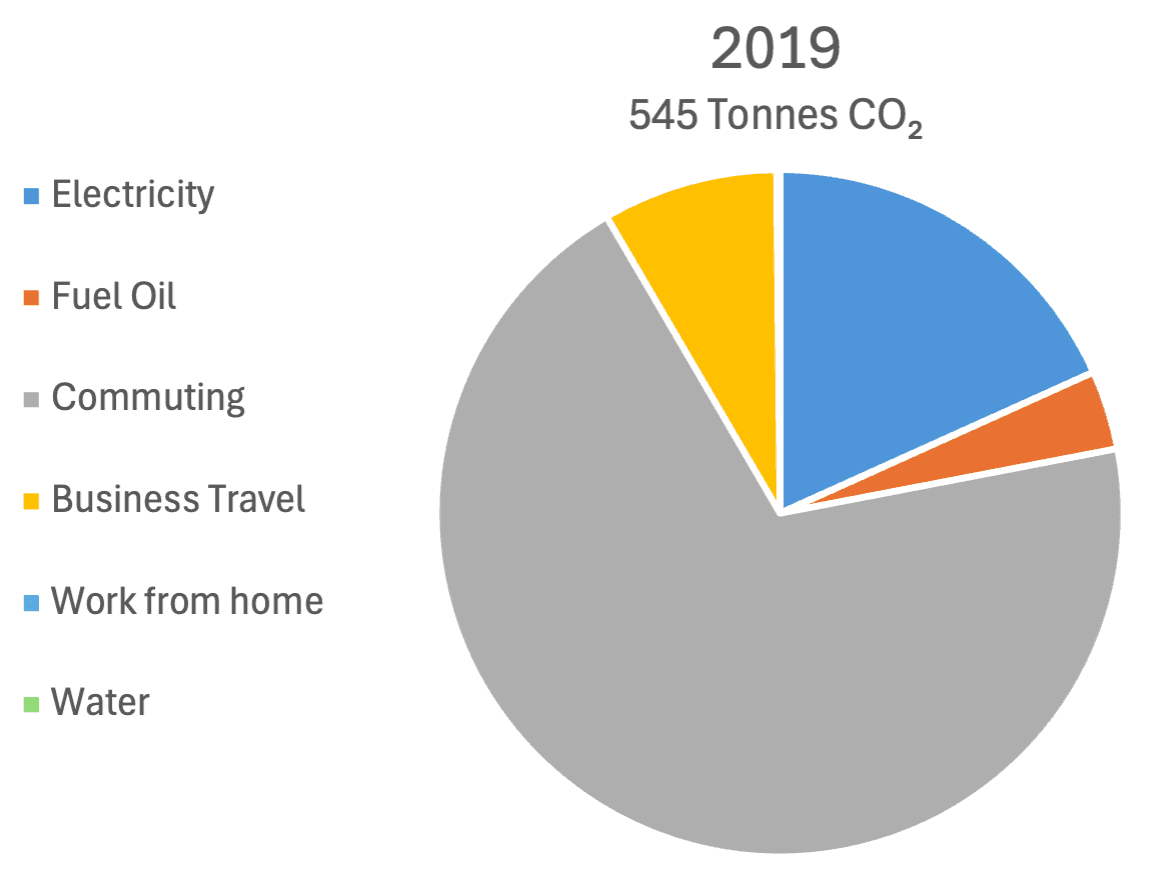
Figure 1: Carbon emission by category (2019-2024), in percentage of Tonnes CO2 equivalent
Figure 2: Annual carbon emissions from 2019 to 2024, with and without normalisation, along with a projected estimate based on an increase in the number of employees equal to half of the target full-time employee vacancies for 2025.
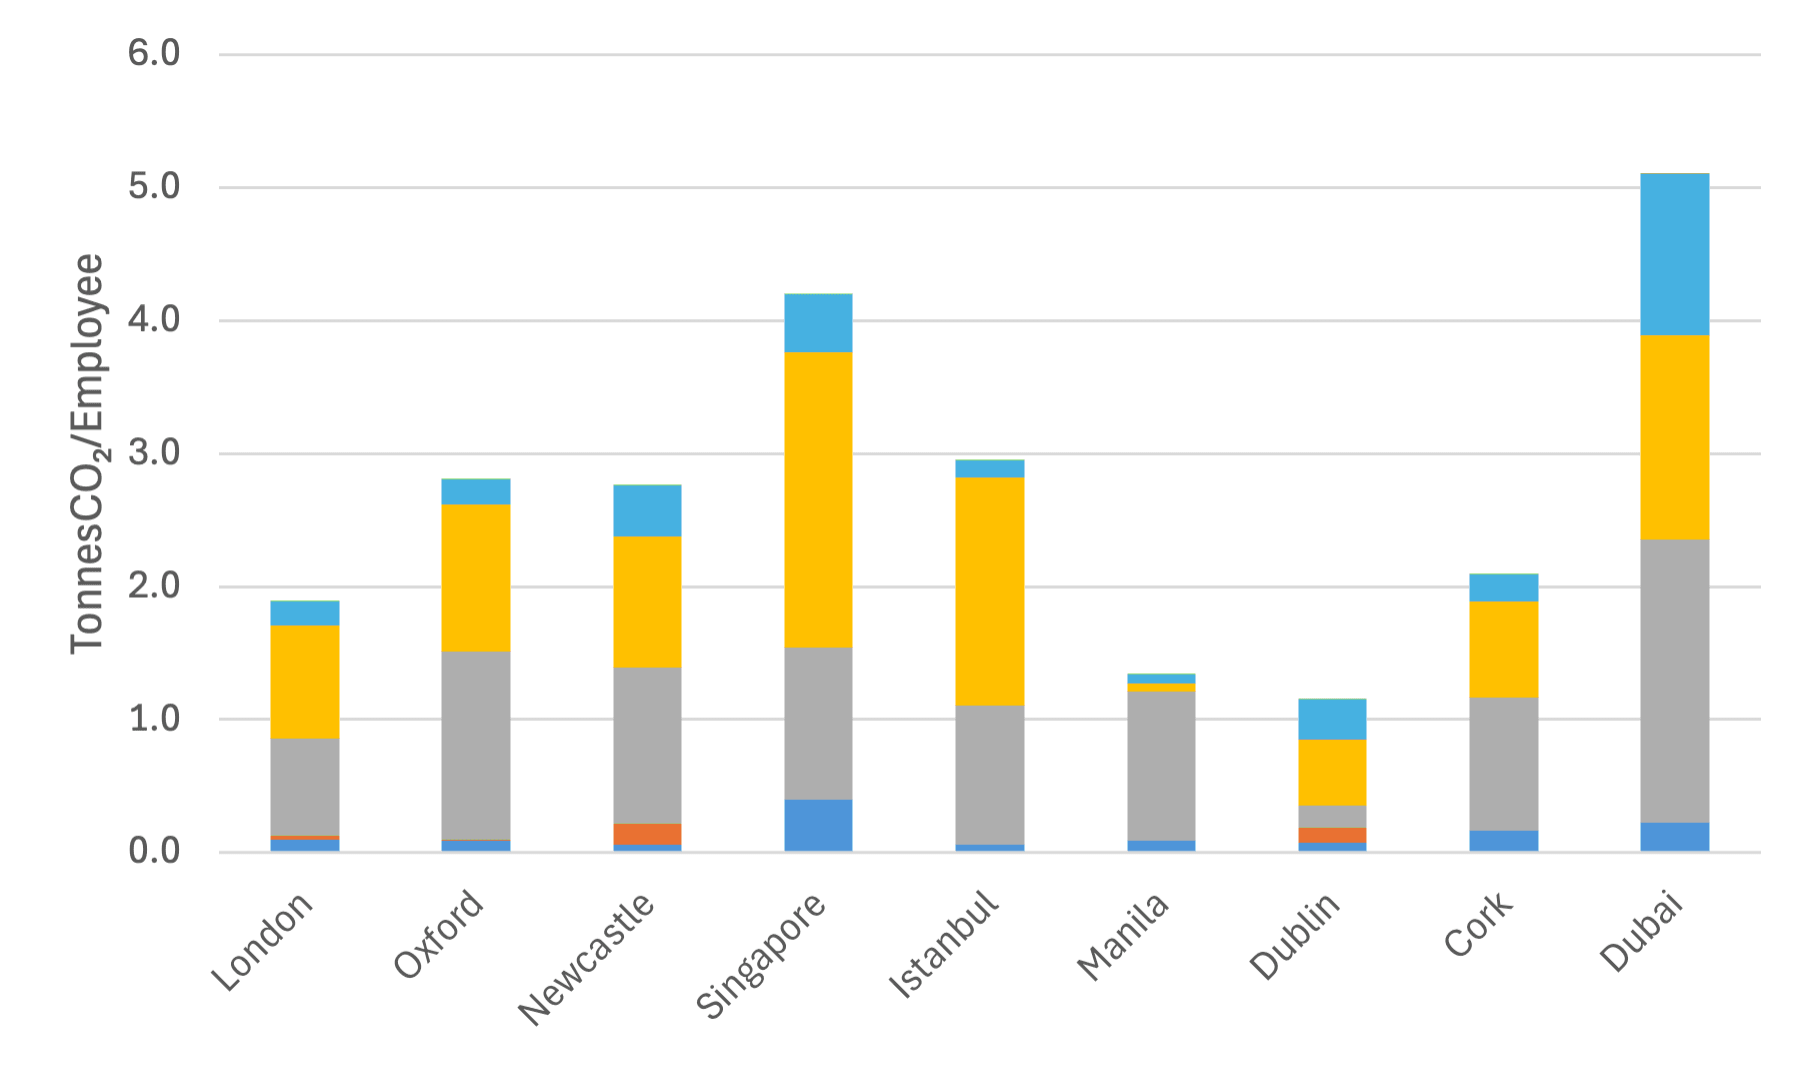
Figure 3: Carbon emission per RED office in 2024, including normalisation per employee.
In 2023, RED predicted a slight reduction in our gross carbon footprint for 2024, based on the stabilisation of carbon factors globally. This would influence the electrical grids our offices depend on and, to a lesser extent, the carbon footprint of certain transportation methods used for commuting. We also expected our commuting and business travel to remain consistent with 2023 levels.
Our prediction regarding carbon emissions from travel proved accurate, and this year we have observed a reduction in our emissions. This change was also influenced by the implementation of a more stringent quality assurance process, which involved removing outliers from the travel data collected through surveys, leading to more accurate reporting.
From 2019 to 2023 at RED, our efforts align to a singular mission: to ‘Make Sustainability Happen Today’. Since 2023 and up to the issue of this report, our constant review and improvement of our goals have led to this statement being challenged and updated to better match the realities of the environments we operate and or performance. The RED Sustainability team continue to work with RED colleagues to achieve our sustainability goals and measure progress against our baseline. However, we acknowledge that RED are a net positive carbon contributor to our parent company, Tractebel, who offset those emissions to achieve the Group’s sustainability goals on an annual basis. This means we cannot state with certainty that we ‘Make Sustainability Happen Today’. Instead, we have clarified our position, aims & goals as below, with future focus being on our ESG Roadmap.
This goal was achieved in 2021 by reducing 21% of our emissions, compared to 2020, and by purchasing both renewable electricity certificates and carbon offset credits for the remaining emissions to become ‘carbon neutral’. Additionally, more offsets were purchased to achieve the ‘negative carbon’ goal.
Since the inception of this goal we have, through ENGIE,1 off-set our carbon footprint to claim that we are ‘Carbon negative’. This practice is under constant review, and while we still believe it is correct to invest in carbon off-setting, we recognise that defining our operations as ‘carbon negative’ could be misleading.
Therefore, while we will continue to strive to meet our energy and carbon targets in the same manner, it is likely that RED will adjust how we describe our operations to align with the EU NFDR & CSRD regulations along with SBTi guidelines in the next few years.
RED have been unable to reduce our gross water consumption in any discernible measure in 2024. This is due to:
Our inability to secure more accurate measurement of our office water consumption.
Our inability to identify specific water usage savings policies or plans.
Our inability to secure internal funding for water restoration certificates (WRCs) to achieve global water balance.
RED does not use a large amount of water. Hence, we have not chosen to invest time and money in addressing this problem and we are unlikely to until we have made greater impacts in our larger GHG emitting activities such as commuting and business travel.
While RED has a continuous focus on collecting waste data in a few of our offices, we have not been able to embed the internal policies and external contracts within all our locations to address this issue globally. It should be noted that while many of our offices are successfully meeting the goals we established, some are still working towards achieving them.
Proposals to increase our work in this area have been put forward for internal approval and updated regulations in the UK may force our previously reluctant landlords to cooperate in providing the infrastructure required to achieve this goal.
To assist in achieving Tractebel group’s goals, RED has set minimum annual targets specific to operations. The table below shows the headline targets and the 2024 performance:
Table 1: Targets
Targets
2024 Performance
A 5% potential demand reduction* year on year
3.96% reduction
A 5% potential carbon reduction** year on year
16.85% reduction
*Potential demand reduction includes office electricity consumption, office gas/fuel oil consumption and working from home energy consumption
** Carbon reduction includes office electricity consumption, office gas/fuel oil consumption, working from home, commuting, business travel, water and waste emissions.
1 For details of REDs carbon off-sets please contact us directly.
The energy audit is a site survey that examines energy conservation and energy flows using data collection, measurement, and their analysis. It identifies the opportunities for system optimisation and reduction of carbon footprint. Office level data is typically collected monthly, as a minimum requirement for energy audit, or using existing or secondary smart meters installed to monitor major energy usage. Ideally, this data streamed from smart meters allows the auditor to analyse hourly energy profile and energy delivered to each system. Subsequently, suitable Energy Efficiency Measures (EEMs) can be identified and applied towards the carbon neutral transition.
Multiple audits were undertaken in 2024. The observations from these have been included in the action plans for each office and communicated with the relevant stakeholders for budgeting approval and execution.
Sending waste to landfill not only takes up valuable land space but also causes air, water and soil pollution, discharging carbon dioxide and methane into the atmosphere. We want to reduce the amount of waste generated across our offices and have continued to undertake waste audits as a means of evaluating current waste management practices and identifying key opportunities to improve diversion and recycling rates.
In 2024, audits have been undertaken at our London, Oxford, and Newcastle offices. The results have been shared internally, and opportunities are in the process of being implemented in 2025. The waste audits are used to plan towards achieving zero-waste and potentially obtaining TRUE certification in the future. The Total Resource Use and Efficiency Certification (TRUE) is a GBCI product dedicated to ‘measuring, improving and recognizing zero waste performance’2. TRUE was released in 2016 and has since been put into practice globally, with more than 350 projects across 32 countries3. We aim to at least align to the zero waste principles which form TRUE, with the goal of pursuing TRUE pre-certification in at least one office by 2026 within our ESG Roadmap.
The following sections summarise RED’s environmental performance from against our baseline in 2019 and last year’s performance. In 2024, RED continued refining its energy and emissions data, as well as enhancing processes to improve the accuracy of its emissions inventory. The data in this report (unless stated otherwise) is from January 1 to December 31, 2024. Targets for 2025 will be set based on progress made since the 2019 baseline year, which marked the start of RED's formal environmental impact reporting.
Carbon factors are standardised values that represent the amount of carbon dioxide (CO2) emitted per unit of energy consumed or activity undertaken. By utilising these established carbon factors, RED ensures greater transparency in its reporting efforts, enhancing transparency in reporting efforts as they are regularly updated to reflect the latest scientific research and changes in energy production and consumption patterns. For 2024, RED’s UK-based offices and Manila have been assigned the most current utility carbon factors, while offices outside the UK are still using older factors. Recognising the need for greater consistency, RED is actively working towards aligning all regions for the 2025 reporting period.
The UK electricity carbon factor fluctuates annually due to changes in the fuel mix, imported electricity, and energy prices. Significant reductions were seen in 2019 (-10%), 2020 (-9%), and 2021 (-9%) due to decreased coal use and increased renewables. This year 2024, the factor remains stable compared to 2023, and future reports will continue to track these variations.
2 TRUE | Zero Waste certification system (gbci.org) 3 Projects | TRUE (gbci.org)
Table 2: Carbon emission factors applied to 2024 calculations per RED-office region
Country
Electricity
Gas
Heating Oil
Water kg/m3 *
Air Travel kg/km (Domestic Average UK)
Air Travel kg/km (Non-UK International Average Passenger)
Ireland
0.322
-
0.000298
0.17580
Philippines
0.5124
Singapore
0.4168
Turkey
0.412
UAE (Dubai)
0.401
UK
0.20705
0.18
0.267
0.27257
The carbon factor for business flights on domestic UK routes increased from 0.2459 to 0.27257 per average passenger. To enhance calculation accuracy and prevent over-reporting, flights for non-UK offices were assigned an international average carbon factor of 0.1758, based on the GHG Government Factors Condensed Set.
4 https://doe.gov.ph/sites/default/files/pdf/announcements/pelp-ig-acu.pdf
For commuting calculations, we continue to use specific carbon factors for each mode of transport, as detailed in Table 4. These factors account for differences in fuel type, vehicle efficiency, and occupancy levels, allowing for a more accurate assessment of the environmental impact of commuting across various office regions.
Table 3: Carbon emission factors applied to 2024 commuting calculations5
Car
kgCO2e/km
Diesel
Petrol
Hybrid
Plug-in Hybrid Electric Vehicle
Battery Electric Vehicle
Unknown
Small - e.g. Ford Fiesta, Renault Clio, Toyota Yaris (and smaller)
0.13994
0.1437
0.11274
0.06078
0.04284
0.14262
Medium - e.g. VW Golf, Ford Focus, BMW 1 Series, Renault Megane
0.16807
0.17726
0.1149
0.09312
0.04625
0.17256
Large - e.g. BMW 3 Series, Skoda Octavia, Audi A4 - (and larger)
0.20729
0.26885
0.15486
0.11923
0.04925
0.22472
5 https://www.gov.uk/government/publications/greenhouse-gas-reporting-conversion-factors-2024
Rail
kgCO2e/passenger.km
Underground
0.0278
National Rail
0.03546
International Rail
0.00446
Bus
Local bus (not London)
0.12999
Local London bus
0.07447
Motorbike
Average
0.11367
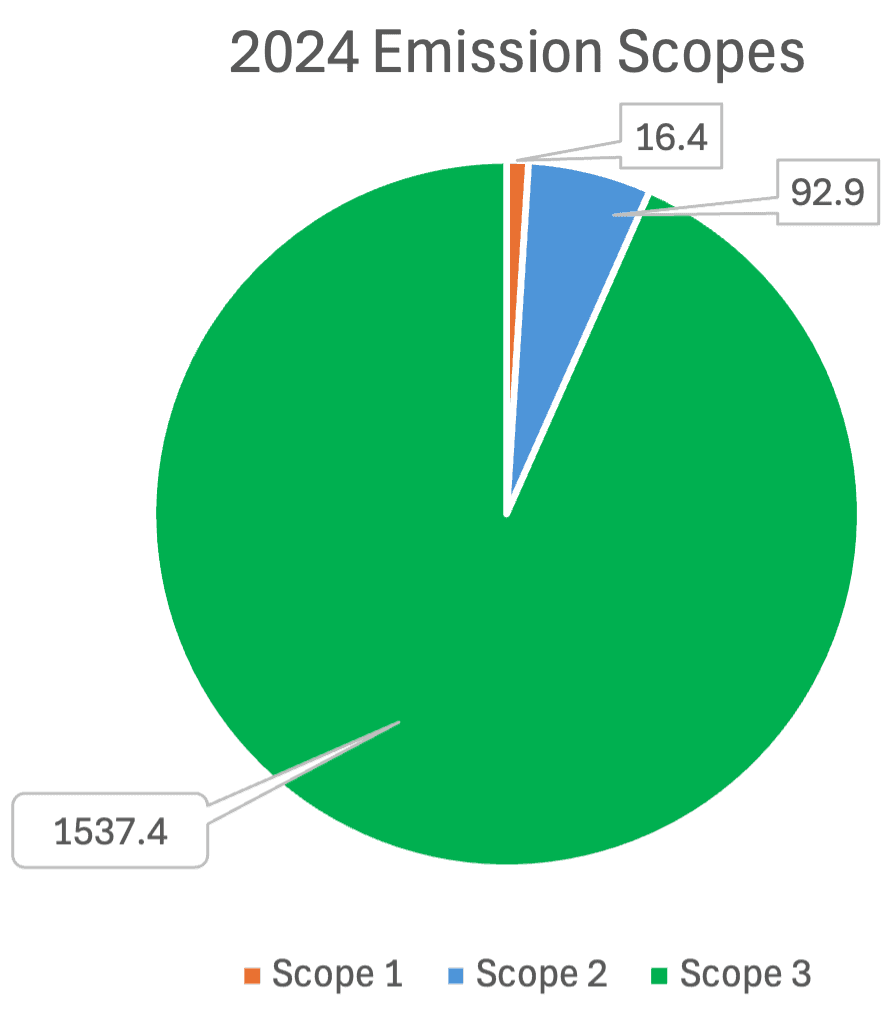
Emissions data is categorised into scopes defined by the Greenhouse Gas Protocol: Scope 1 (direct emissions from owned or controlled sources), Scope 2 (indirect emissions from the generation of purchased electricity), and Scope 3 (all other indirect emissions, such as from business travel, commuting, waste, water usage, and working from home).
The scope of our environmental impact extends beyond our fuel and energy emissions. With the post-COVID return to normal and increased office attendance, many organisations have stopped reporting remote work emissions. However, as a hybrid company, we recognise the importance of including these emissions in Scope 3. We are also in the process of expanding our Scope 3 reporting to account for embodied carbon within our projects.
Table 4: RED total emissions in tonnes of CO2 for 2024 across the emission scope categories
Scope 1 Direct Emissions (Tonnes of CO2)
Scope 2 Indirect Emissions (Tonnes of CO2)
Scope 3 (Tonnes of CO2)
16.41
92.92
1,537.36
Figure 4: Emissions by Scope
Figure 5: Energy Consumption breakdown by category for 2019,2023 and 2024
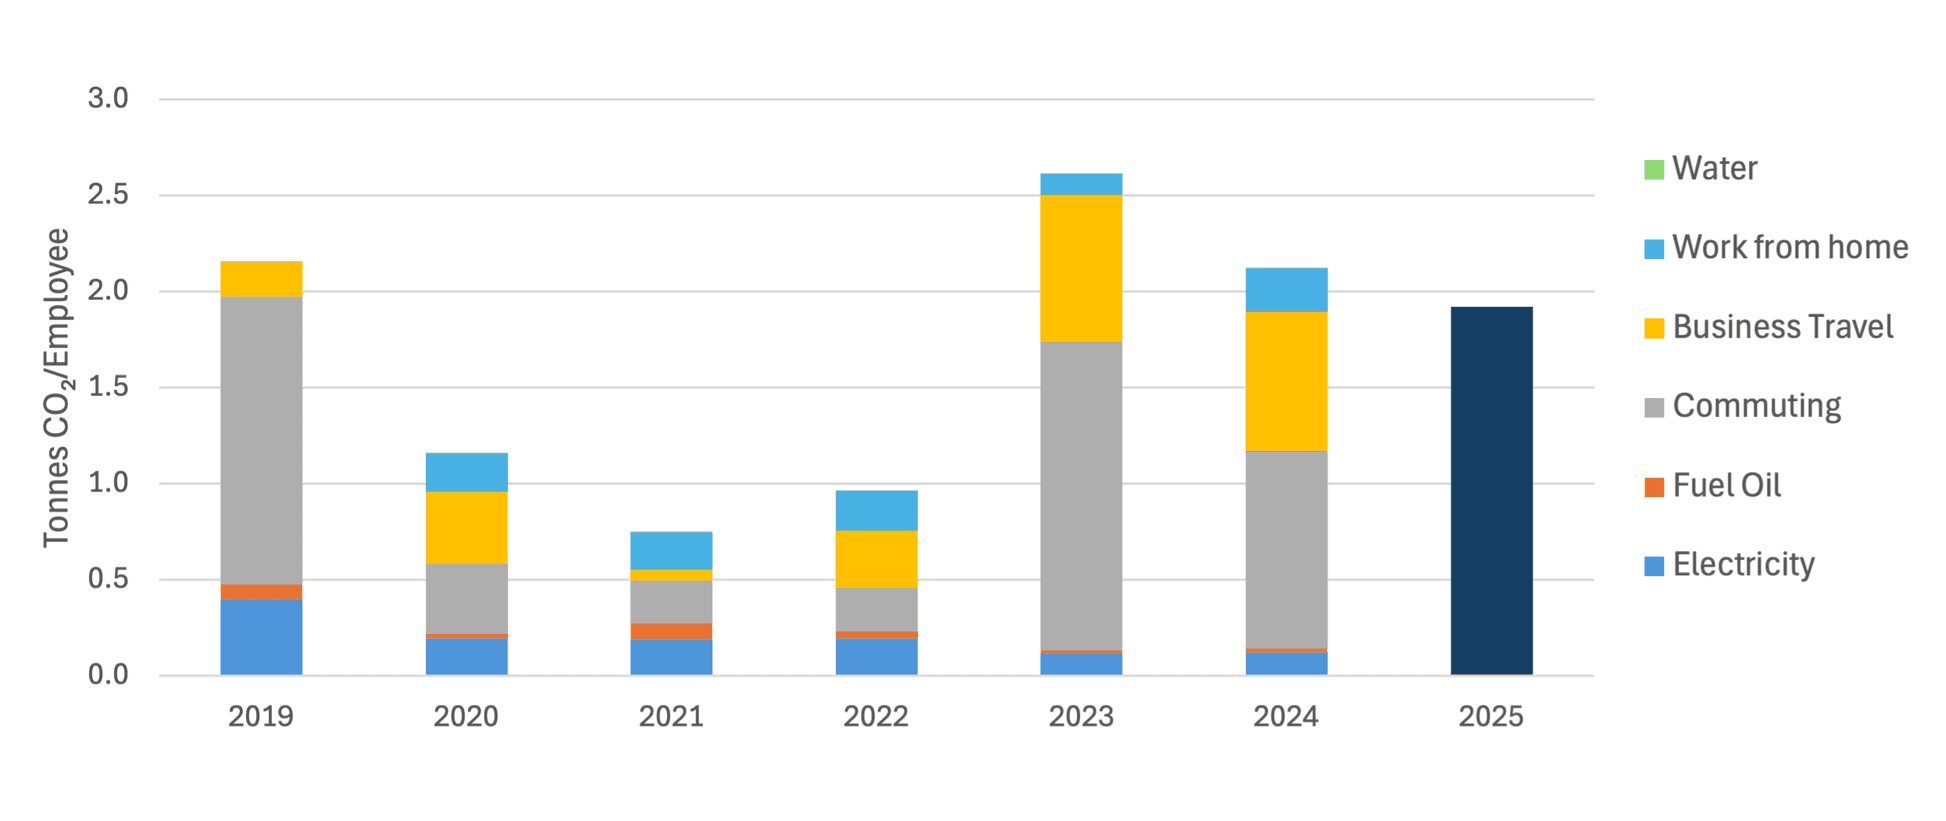
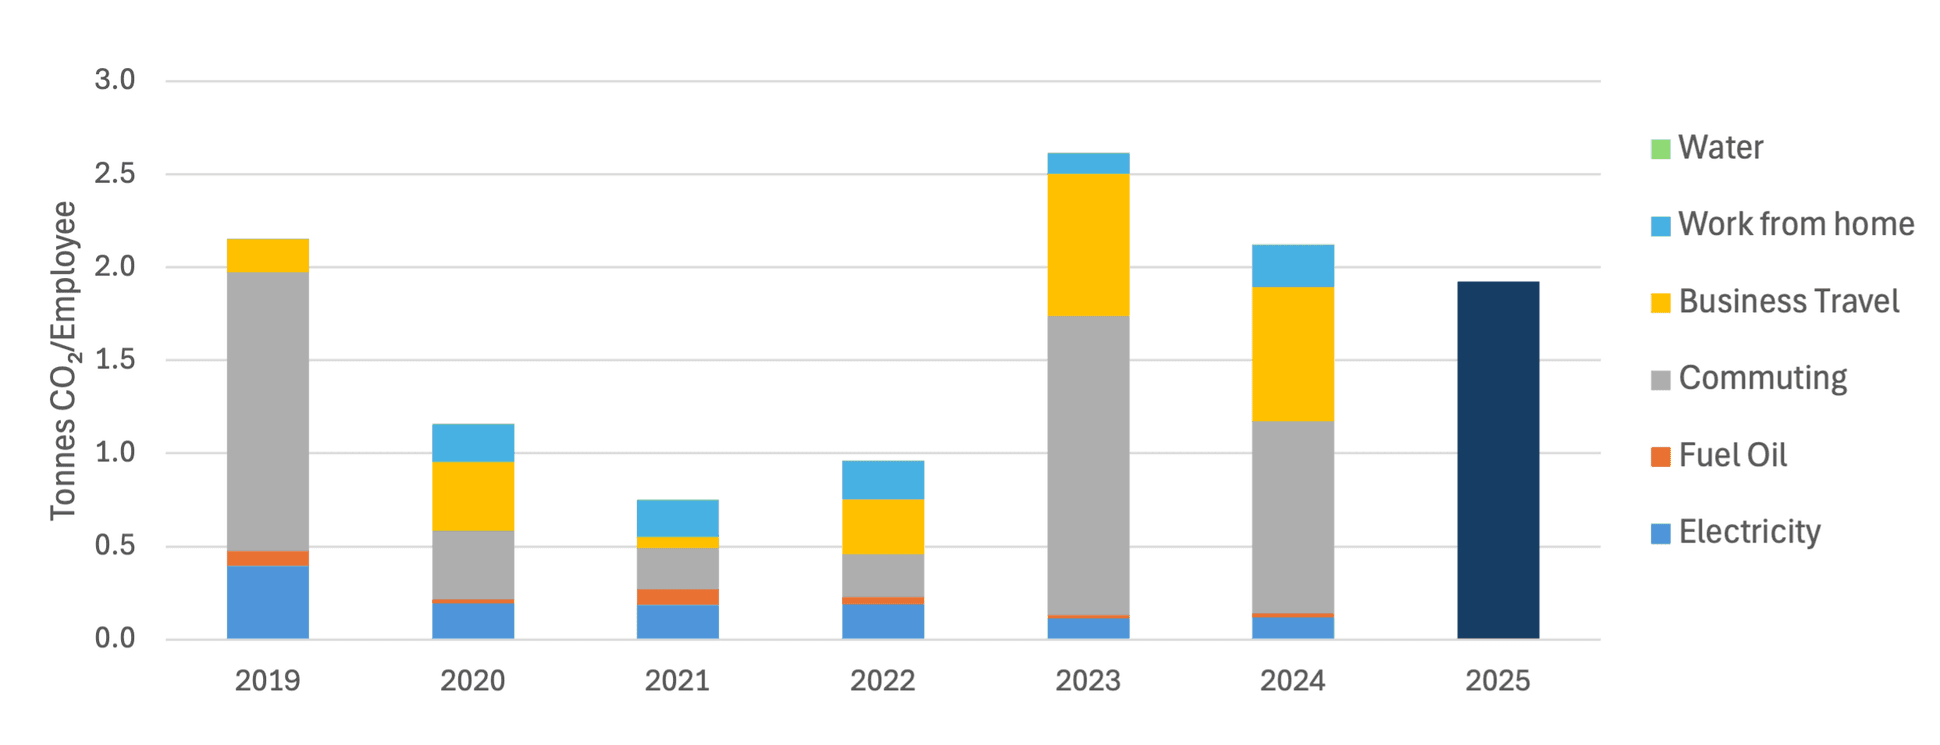
Figure 6: Annual per-employee carbon emissions by major energy use categories (2019-2024), with a 2025 estimate based on an increase in the number of employees equal to half of the target full-time employee vacancies for 2025
Table 5: Energy Consumption (kWh) per category and associated carbon emissions (Tonnes CO2) calculated using specified emission factors for 2023, 2024 and baseline of 2019
Consumption
2019 Baseline
2023
2024
Usage Unit
Tonnes CO2
Electricity (kWh)
250896.2
99.5
243546.7
86.2
291368.5
92.9
Gas / Fuel Oil (kWh)
99693.8
20.3
66612.0
12.5
83134.0
16.4
Commuting (miles)
1897000.0
379.4
4436634.6
1219.8
3598082.8
799.5
Business Travel (miles)
391304.3
45.0
2381977.6
577.8
2638583.5
563.2
Work from home (kWh)
0.0
384925.5
83.6
604852.5
174.2
Water (m3)
3000.0
0.9
1530.9
0.45
1387.7
0.41
Between 2019 and 2023, electricity consumption declined by 2.9%, leading to a significant reduction in CO₂ emissions. However, in 2024, electricity usage rose by 19.6% compared to the previous year, resulting in a 7.8% increase in emissions. Similarly, gas and fuel oil consumption dropped by 33.2% from 2019 to 2023, however this year consumption has risen 24.8%, causing emissions to increase by 31.2%. This rise is mainly driven by business growth, including an expanding workforce and improved accuracy in tracking energy consumption across offices. In previous years, many office locations relied on estimated data, whereas in 2024, greater data availability enabled a more accurate assessment of actual usage, leading to the reported increase.
Table 6: Carbon emissions from electricity and gas/ fuel for 2019, 2023 and 2024
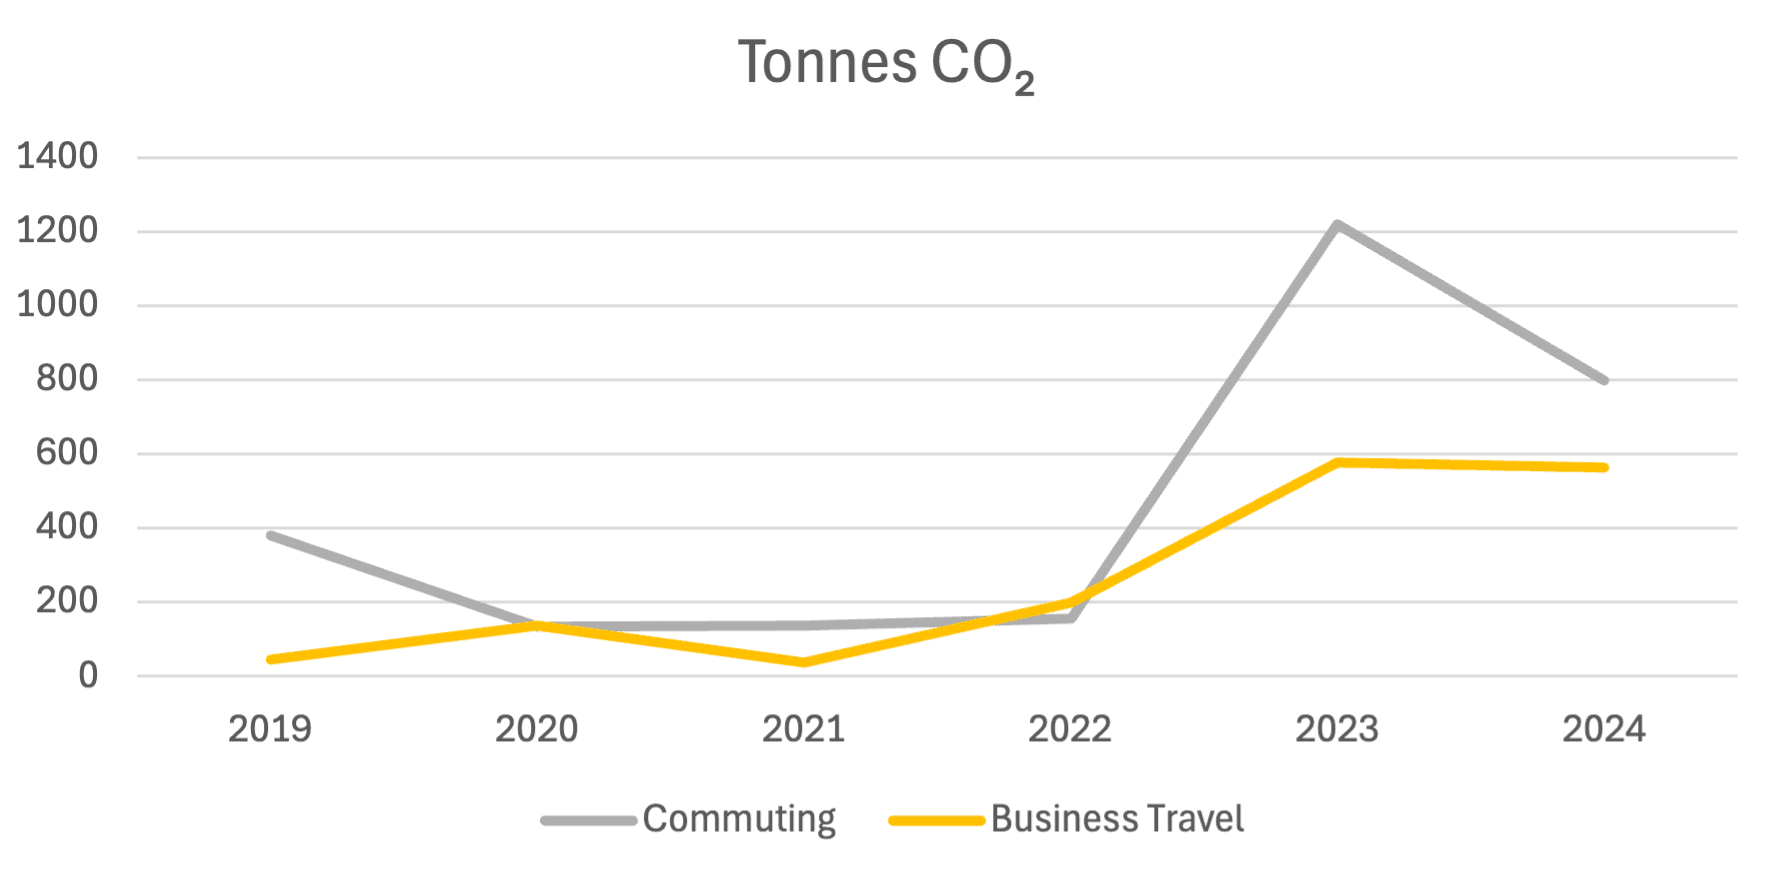
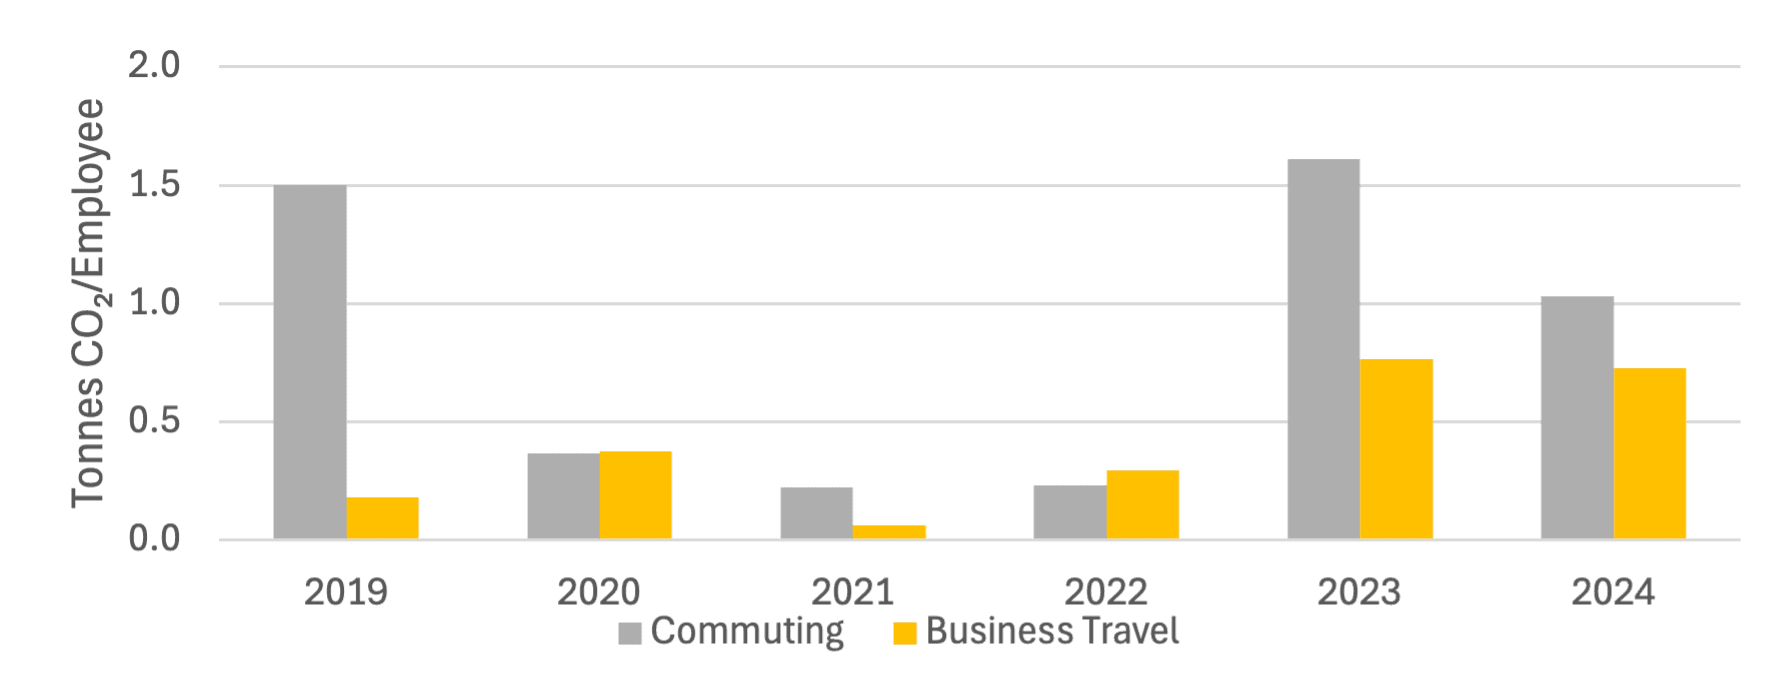
Both commuting and business travel, our two largest consumption categories, saw reductions in CO2 this year. Commuting emissions dropped significantly, from 1,219 tonnes of CO2 to 799 tonnes. This decrease is due to a more rigorous data quality assurance process, which identified and excluded anomalous survey data. Business travel emissions remained stable despite expanding our dataset to include mileage data from non-European offices. This provided a clearer picture of travel emissions across regions, revealing a consistent trend in flight-related emissions. As the dataset grows, we can further refine our analysis of long-term travel patterns.
Participation in the annual commuting survey increased to 52%, up 4% from 2023. Despite the reduction in commuting emissions, the 799 tonnes still reflects a 110.73% increase from our baseline year, in line with the rise in employee numbers from 253 to 777 in 2024.
For more accurate reporting in 2025, we will include data on flight haul and class type, which are not currently tracked. This will help identify opportunities to reduce emissions, particularly by limiting business class travel, as it occupies more space per passenger and results in a higher share of emissions.
Table 7: Carbon emissions from commuting and business travel for 2019,2023, and 2024
km
Commuting
1,897,000.0
4,436,634.6
3,598,082.8
Business travel
391,304.3
2,381,977.6
2,638,583.5
Figure 7: Travel related carbon emissions (2019-2024)
Figure 8: Normalised annual carbon emissions per employee from travel (2019 to 2024)
At present, many RED sites do not have metered water consumption. This is primarily due to shared services with neighbouring facilities or the inclusion of water costs in lease contracts. In instances where this applies, estimates are based on an average of 12m3 per employee, per annum, derived from a comprehensive investigation led by the ENGIE Impact team across the wider group.
In some office regions, consumption will be higher, while in others—such as our UK offices—it is likely to be lower. As most of our offices are not metered, opportunities for water savings are limited. The ability to install meters is also constrained, as it largely depends on the landlord. Looking ahead, we are planning to incorporate metered water data into our future monitoring efforts where viable, as detailed in the Appendix. This will enhance the accuracy of our reporting in the times to come.
Table 8: Average Annual Water Consumption* (2019, 2023, and 2024)
m3
Water
3000
0.5
0.4
*Estimated from 12m3 annual average per employee, where RED employees’ annual average numbers were: 253, 758 and 777 for the years 2019, 2023 and 2024 respectively.
At RED, we are committed to reducing the amount of waste generated across all our offices. We actively educate employees on recycling initiatives, available waste streams, and the principles of the circular economy. We also encourage sustainable practices such as waste reduction, material reuse, and responsible consumption. Waste management is handled locally at each RED site, and this is part of our implementation of the ISO 14001 environmental management standard.
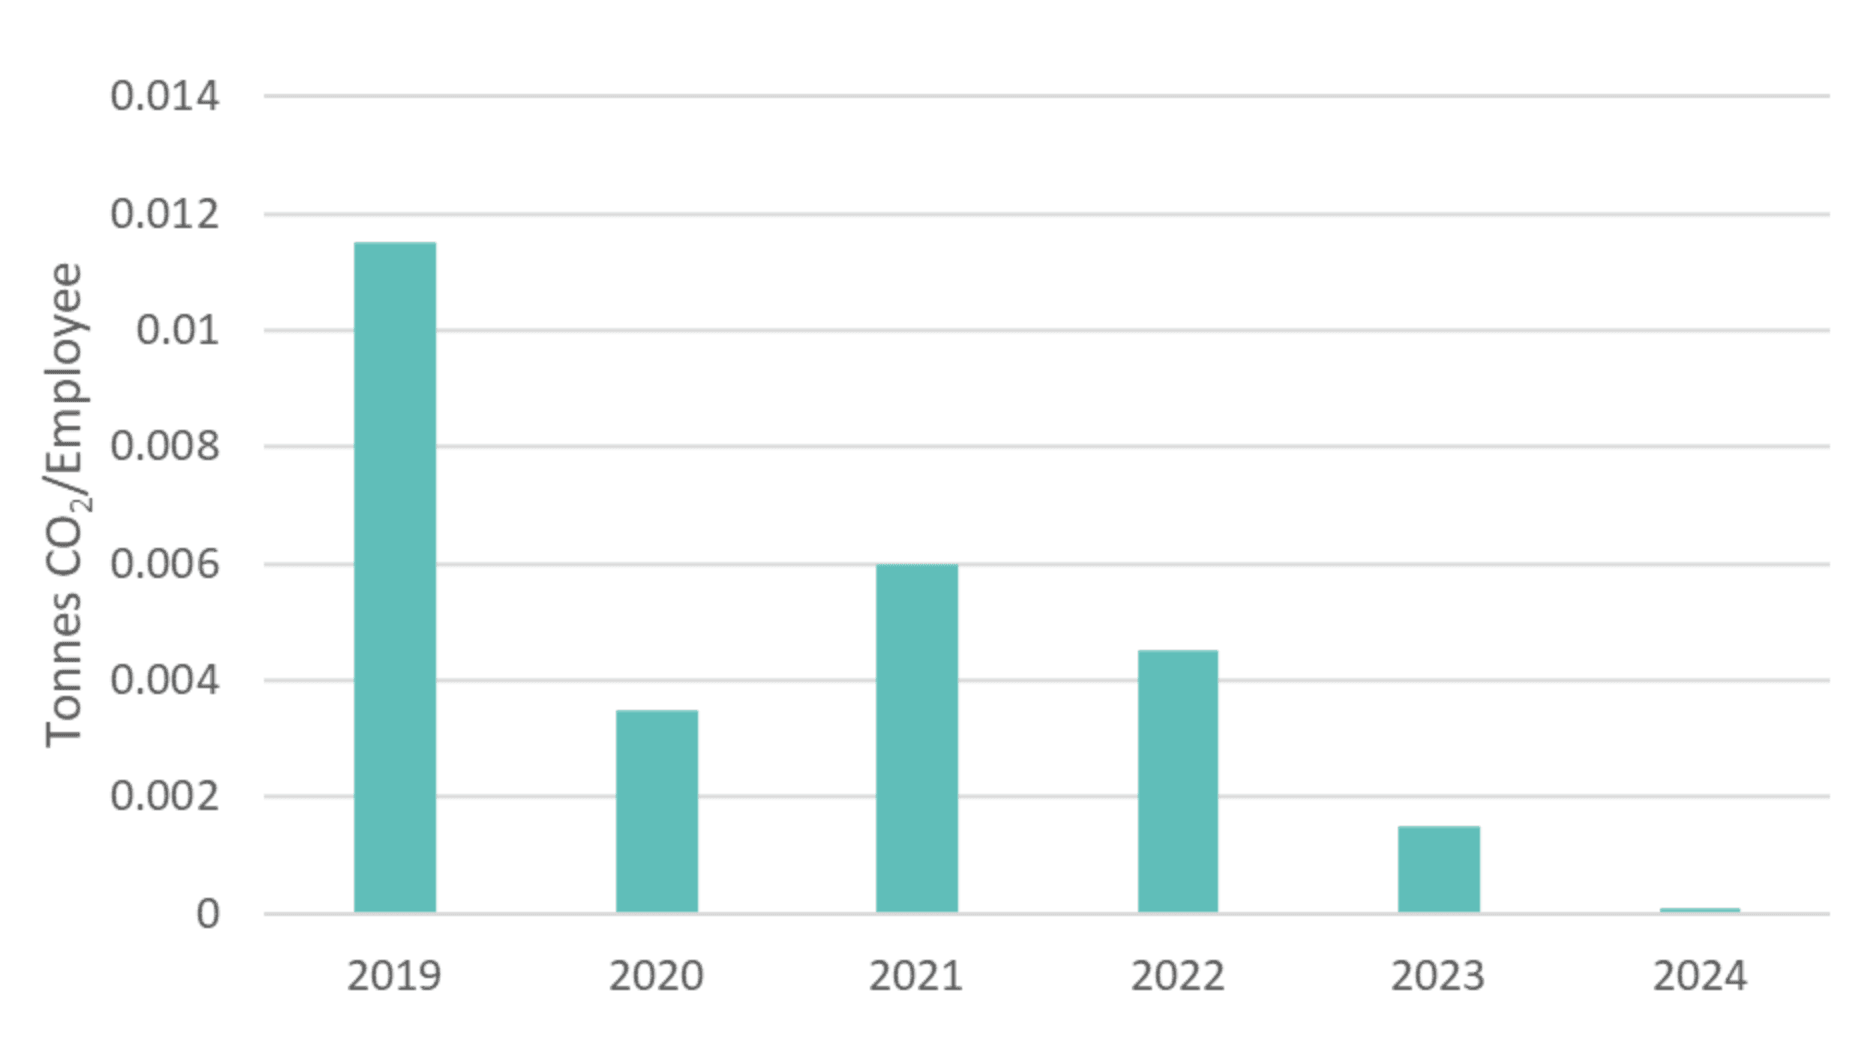
Quantifying the carbon footprint from waste is a complex task and is included in RED’s future monitoring plan. In this report, the data presented below (Table 8) represents an estimated snapshot of the company’s waste impact, based on waste audits conducted in our UK offices. The average waste per employee figure from these audits has been applied to RED’s total employee count. The carbon factor used to calculate the Tonnes of CO2e is the UK carbon factor, sourced from the UK Government Department for Energy Security and Net Zero for the respective years. Data from previous years is based on example audits conducted by the wider group, ENGIE Impact. Figure shows a bar chart of normalised carbon footprint per employee due to the estimate of generated waste for the period from 2019 to 2023 and future projection assuming 5% carbon reduction.
Table 9: Carbon emissions due to the handling of material waste and future projection
Usage Unit (Tonnes)
Material Waste
3
39.7
0.8
9.3
0.06
Figure 9: Annual carbon emissions from waste handling, normalised per employee.
Office occupancy data is collected through the LIVING@ online software, which tracks desk bookings and office attendance. We recognise that assumptions apply when using this data, such as instances where individuals reserve a desk but do not show up, come to the office without booking, or use meeting rooms scheduled by an administrator. We believe the incidents of non-attendance and unreserved office attendance to a large extent even themselves out and as such we have not applied any factors to attempt to correct these inaccuracies.
CO2 emissions associated with working from home are calculated using data from the office attendance booking system, integrated with region-specific averages for household electricity and gas consumption and average household occupancy statistics.
Table 10: Average household annual electricity and gas consumption
384,925.5
604,852.5
Category
Manila
UAE
Average Household Annual Electricity Consumption
3,226.7
29,874.7
3,509
11,690
98,000
4,200
Average Household Natural Gas Consumption
11,500
11,000
Average Number of People in Household
4.1
3.1
2.36
3.34
4.9
2.74
Table 11: Work from home consumption for 2019, 2023, and 2024
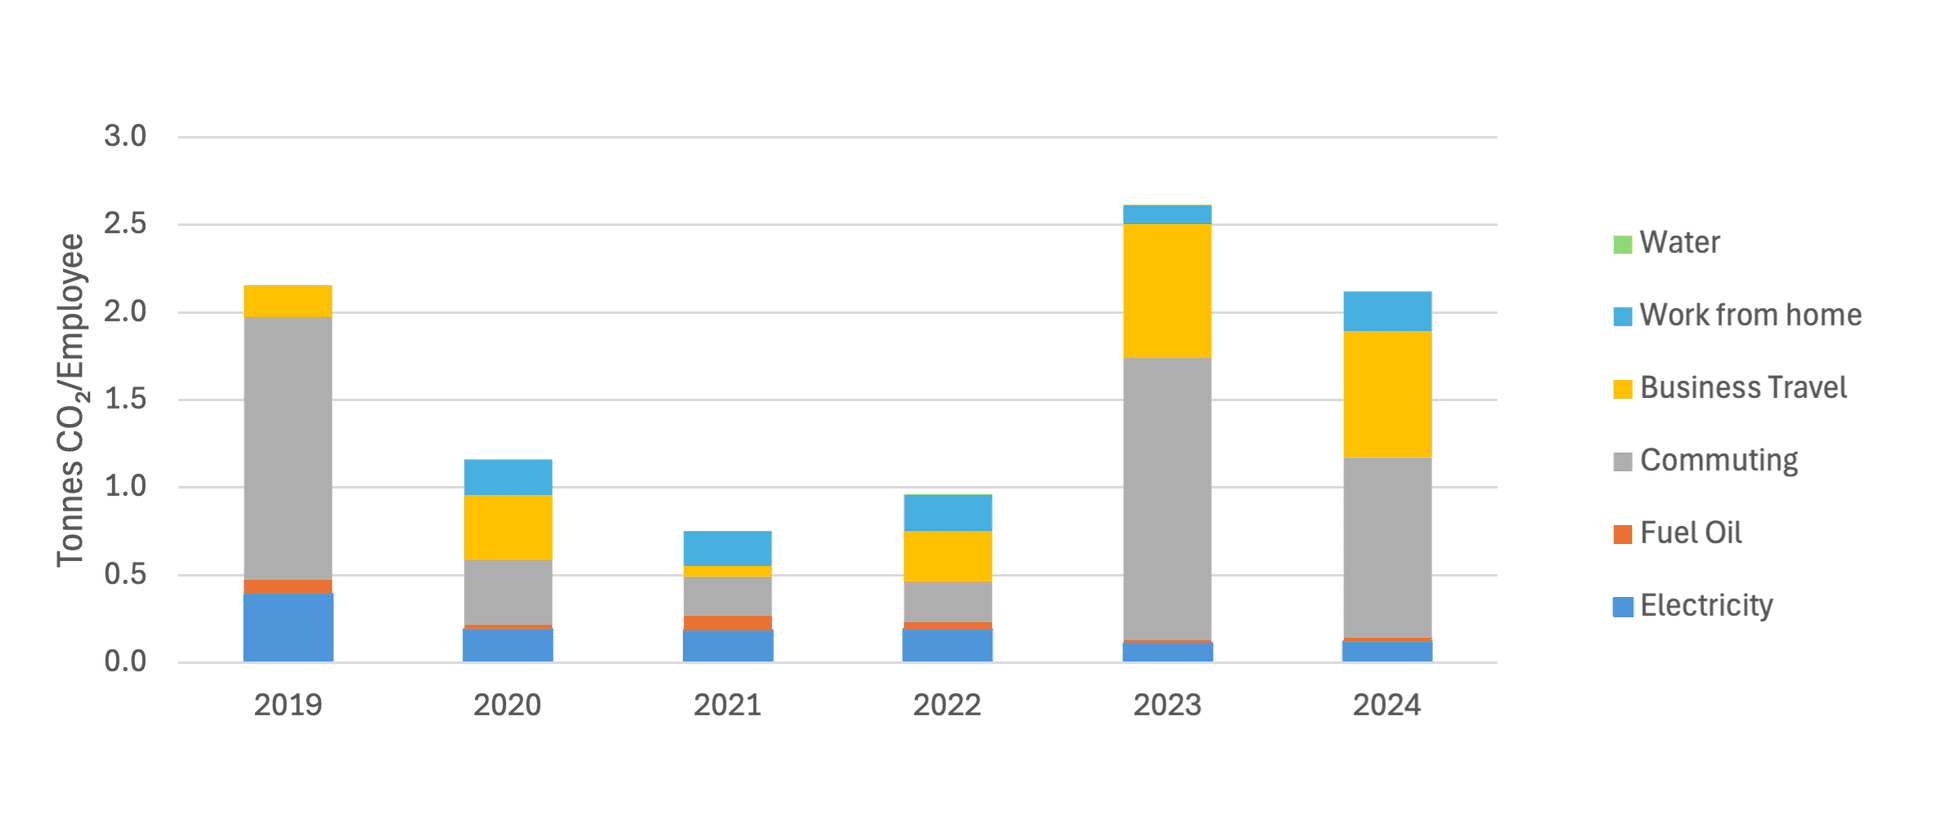
This year, RED achieved a reduction in its emissions rate per employee, a key performance indicator (KPI) for evaluating its carbon footprint, decreasing from 2.61 to 2.12 tonnes of CO2. While category-specific metrics provide insight into areas for potential improvement, monitoring emissions per employee allows for meaningful comparisons with industry peers.
2019
0.39
0.11
0.12
0.08
0.02
1.50
1.61
1.03
0.76
0.72
0.00
0.22
Total
2.15
2.61
2.12
Table 12: Comparison of Tonnes of CO2 per employee between 2023-2024, and our baseline (2019).
Figure 10: Total CO2 emissions per consumption category normalised by the number of employees (2019-2024)
This report provides an overview of RED’s environmental performance across various consumption categories, assessed on a site-by-site and employee-specific basis. Data normalisation is based on employee numbers and office area. The latter highlights variability in site occupancy density, particularly between APAC and EMEA regions. RED's performance is presented as total carbon emissions in tonnes CO2 divided by the number of employees, offering a clear measure of annual performance.
Last year, we introduced a new data collection process for company-wide commuting patterns, leading to a significant increase in travel-related emissions. In response, we have implemented strategies to reduce these emissions and strengthened the quality assurance process for survey-derived data to minimise any outliers that could skew results.
The total emissions by RED in 2024 was 1,647 Tonnes CO2 which represents a 2.12 Tonnes CO2 per employee.
This report has highlighted that progress is not necessarily straightforward, nor is it always linear. Therefore, we are setting out a companywide strategy to enable appropriate progress in all global locations. Each location will have its own challenges and therefore progress should look distinct.
We have global efforts for achieving energy savings across our offices. These have been framed through the UK legislation the Energy Saving Opportunity Scheme (ESOS). We must report against this legislation for our UK operation, so we have implemented a global ESOS action plan to the cover the period up to December 2027. All actions are in alignment with our ESG Roadmap, ISO 14001 and ISO 50001 management systems and relevant KPIs to ensure we remain focussed on delivering on being an environmentally sustainable business.
Below we have summarised these actions as they have been reported in our ESOS action plan for implementation across the business in discussion with local resources.
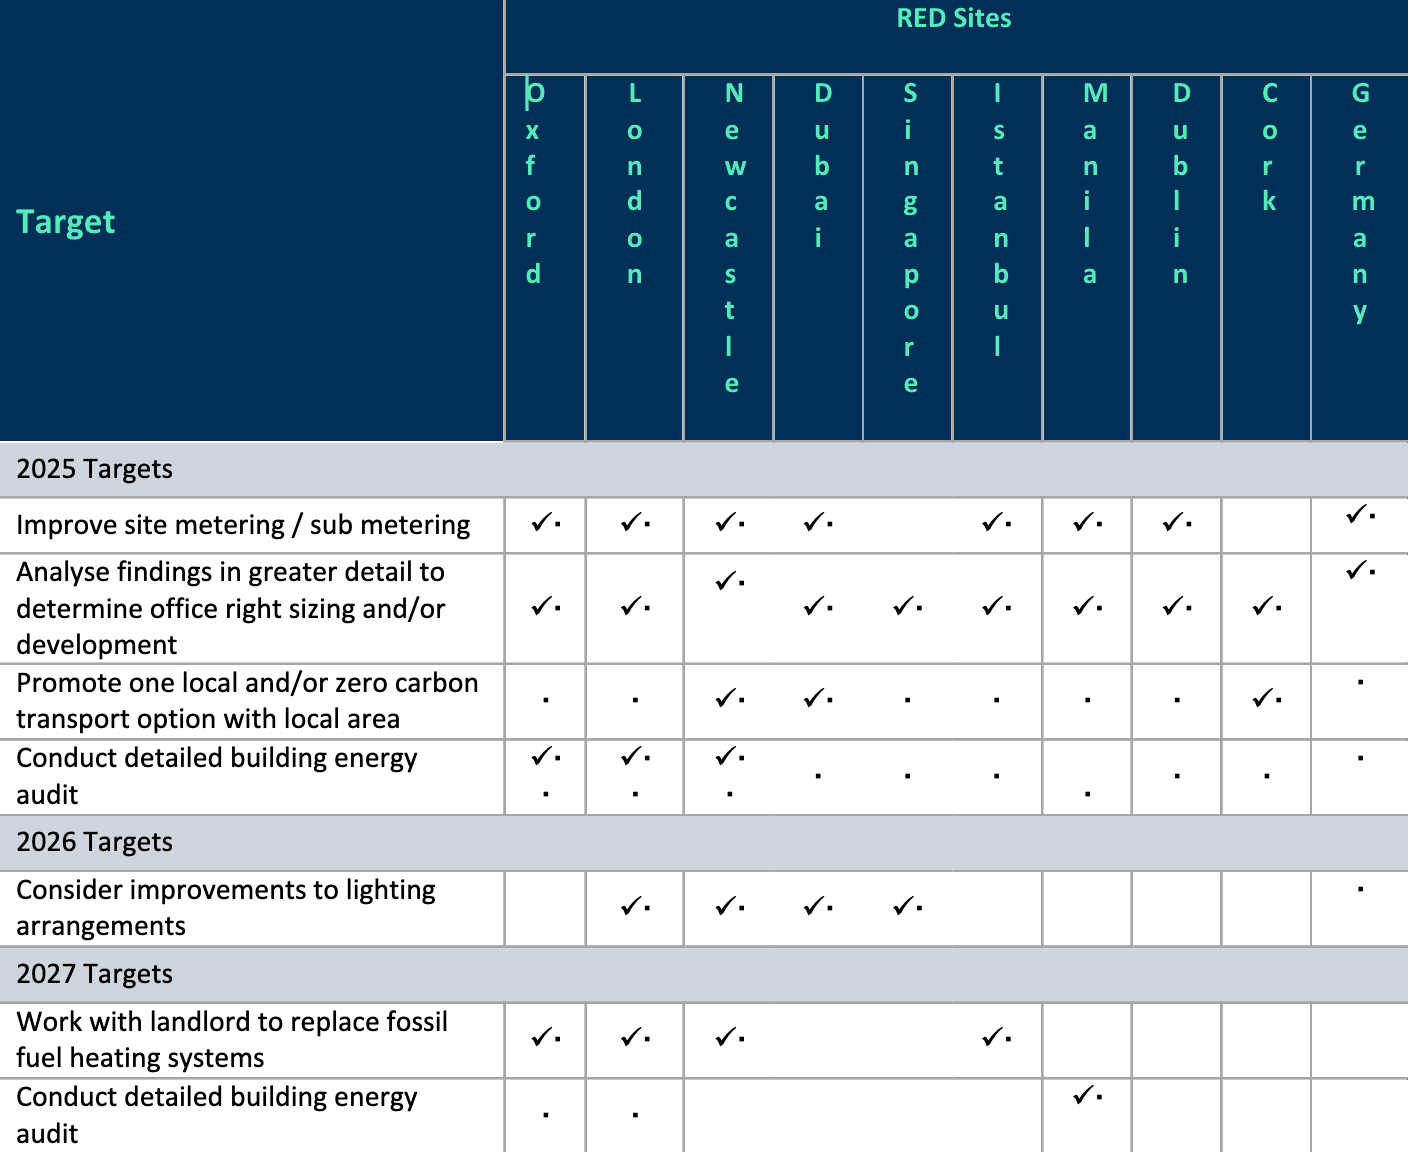
Table 13: RED sites’ targets for 2025